

Search latency
The search latency chart tracks response times at four percentiles: p75, p90, p95, and p99, measured in milliseconds.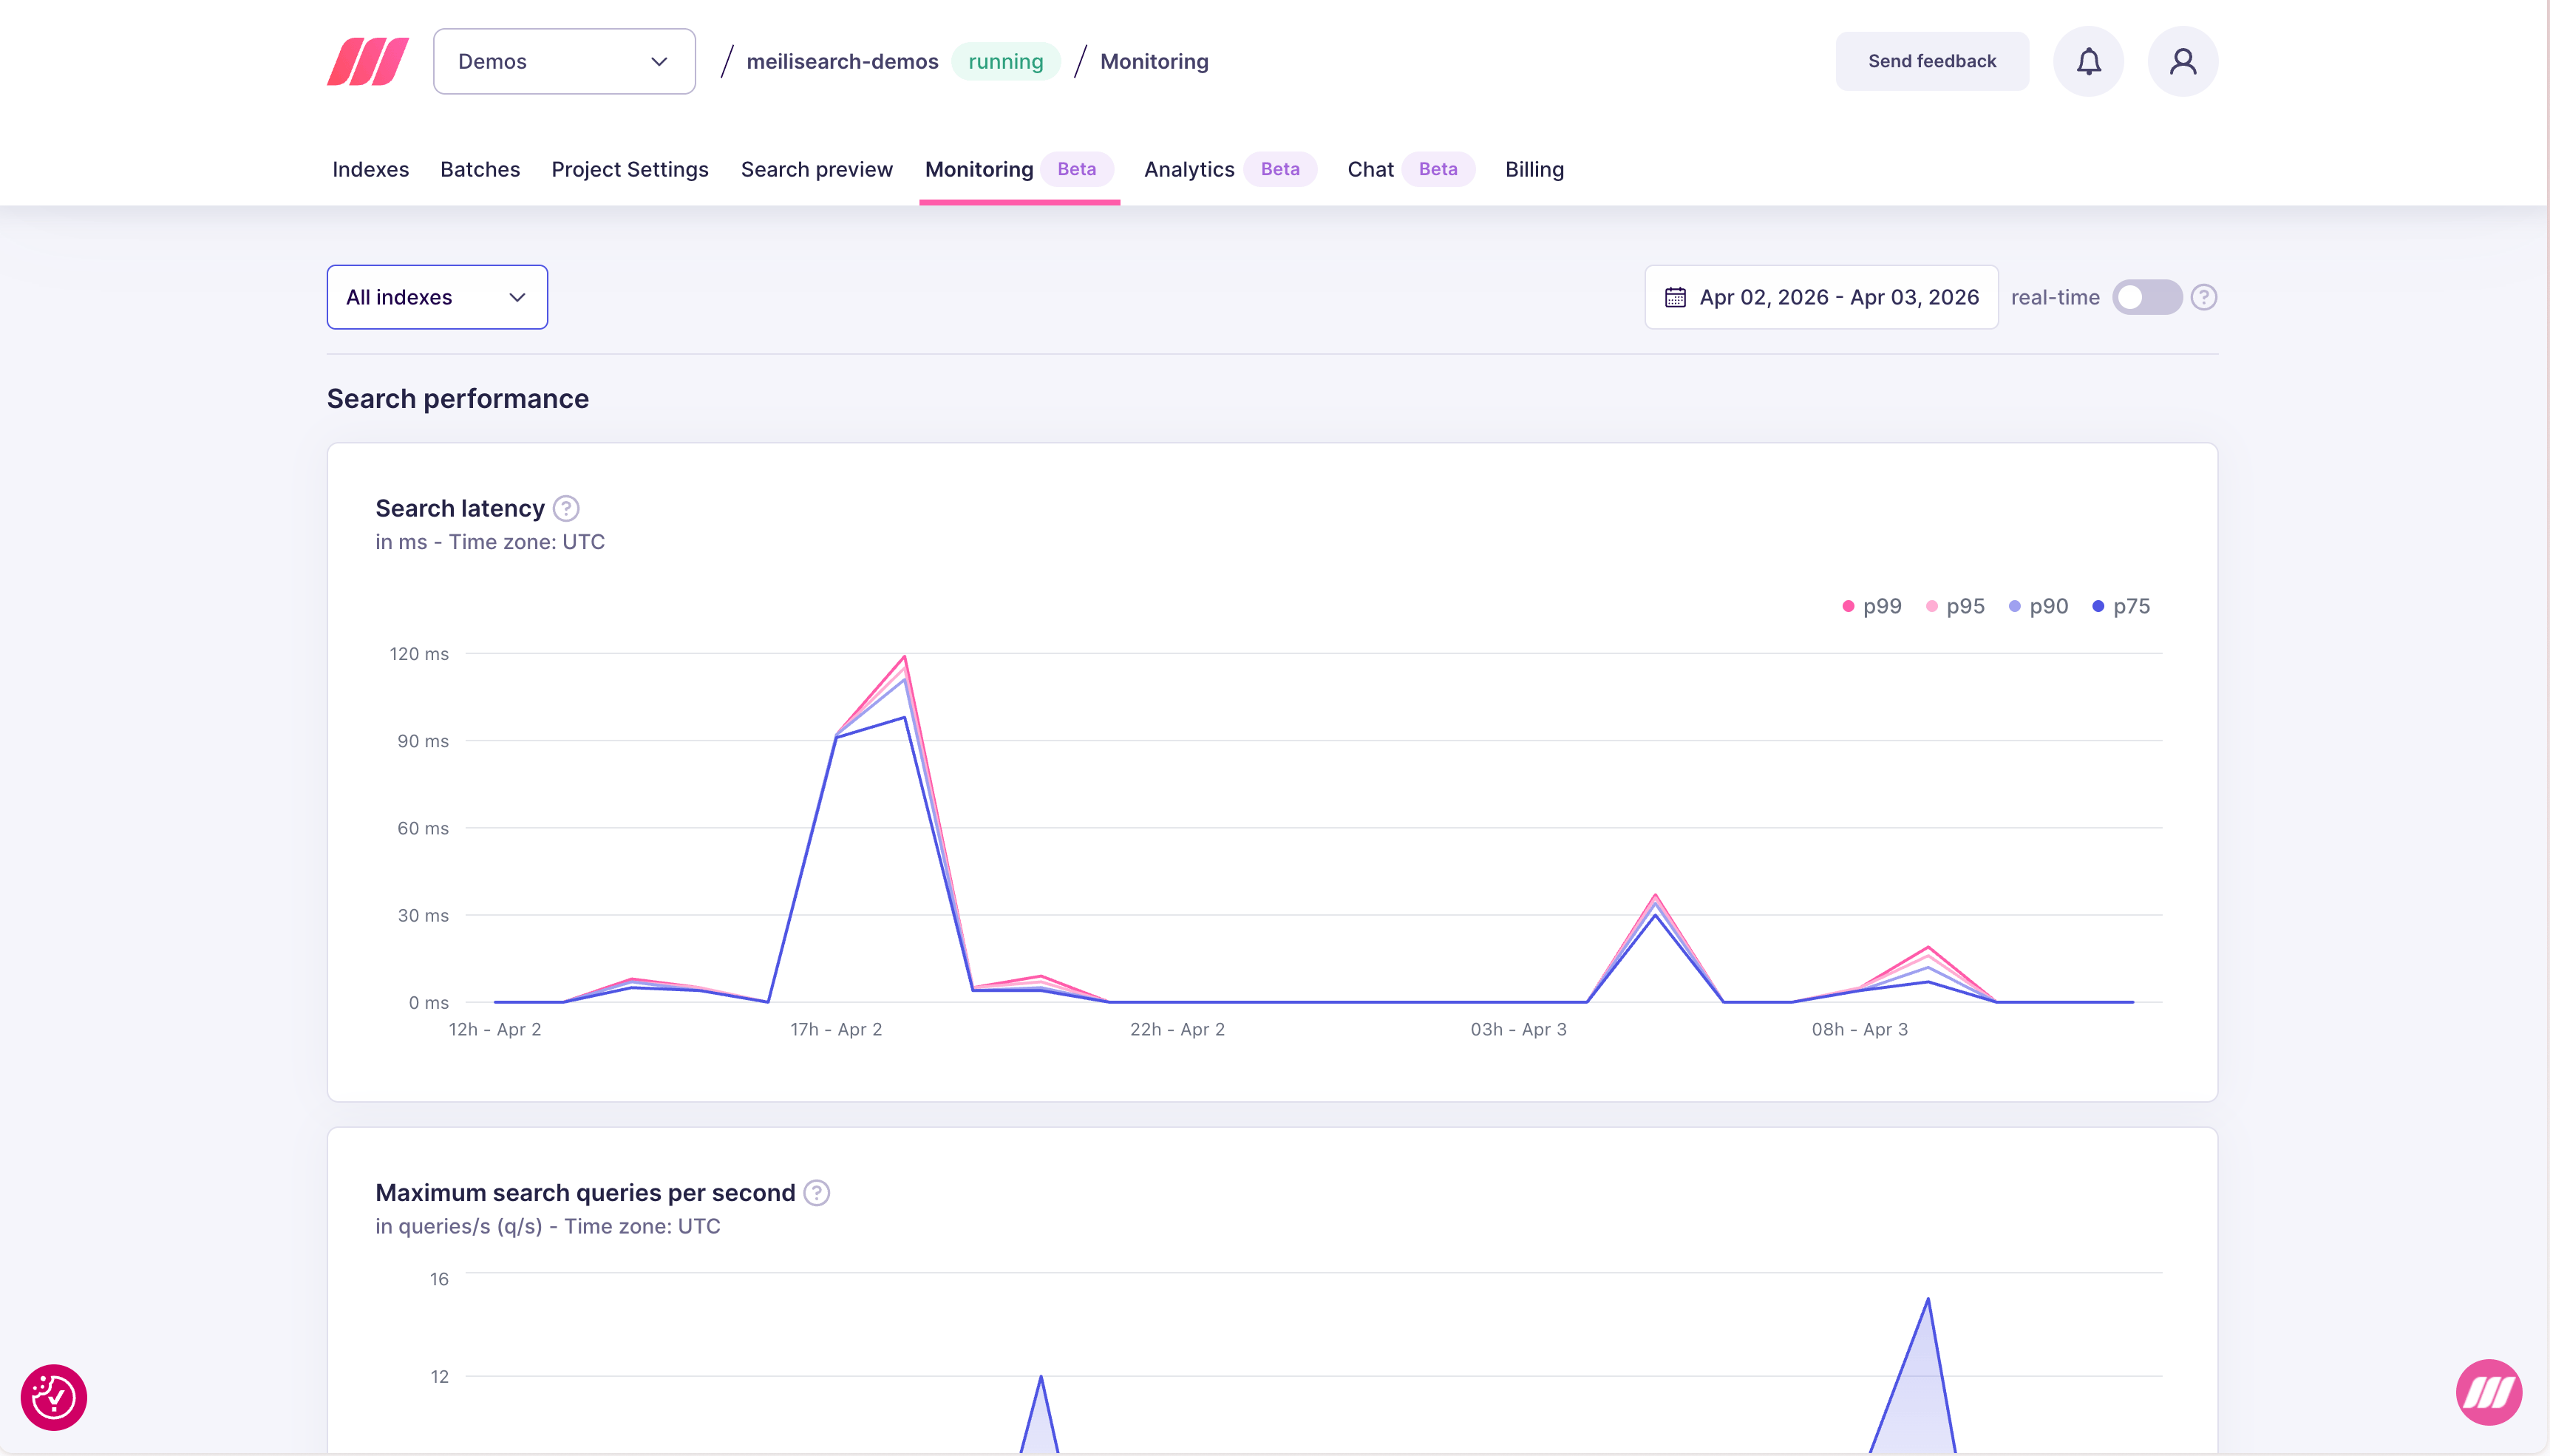
p99 latency is the most important signal for user experience: even rare slow queries are visible to users. A healthy p99 is typically under 100 ms for most workloads.
Maximum search queries per second
This chart shows the peak number of search requests processed per second (q/s) during each time interval.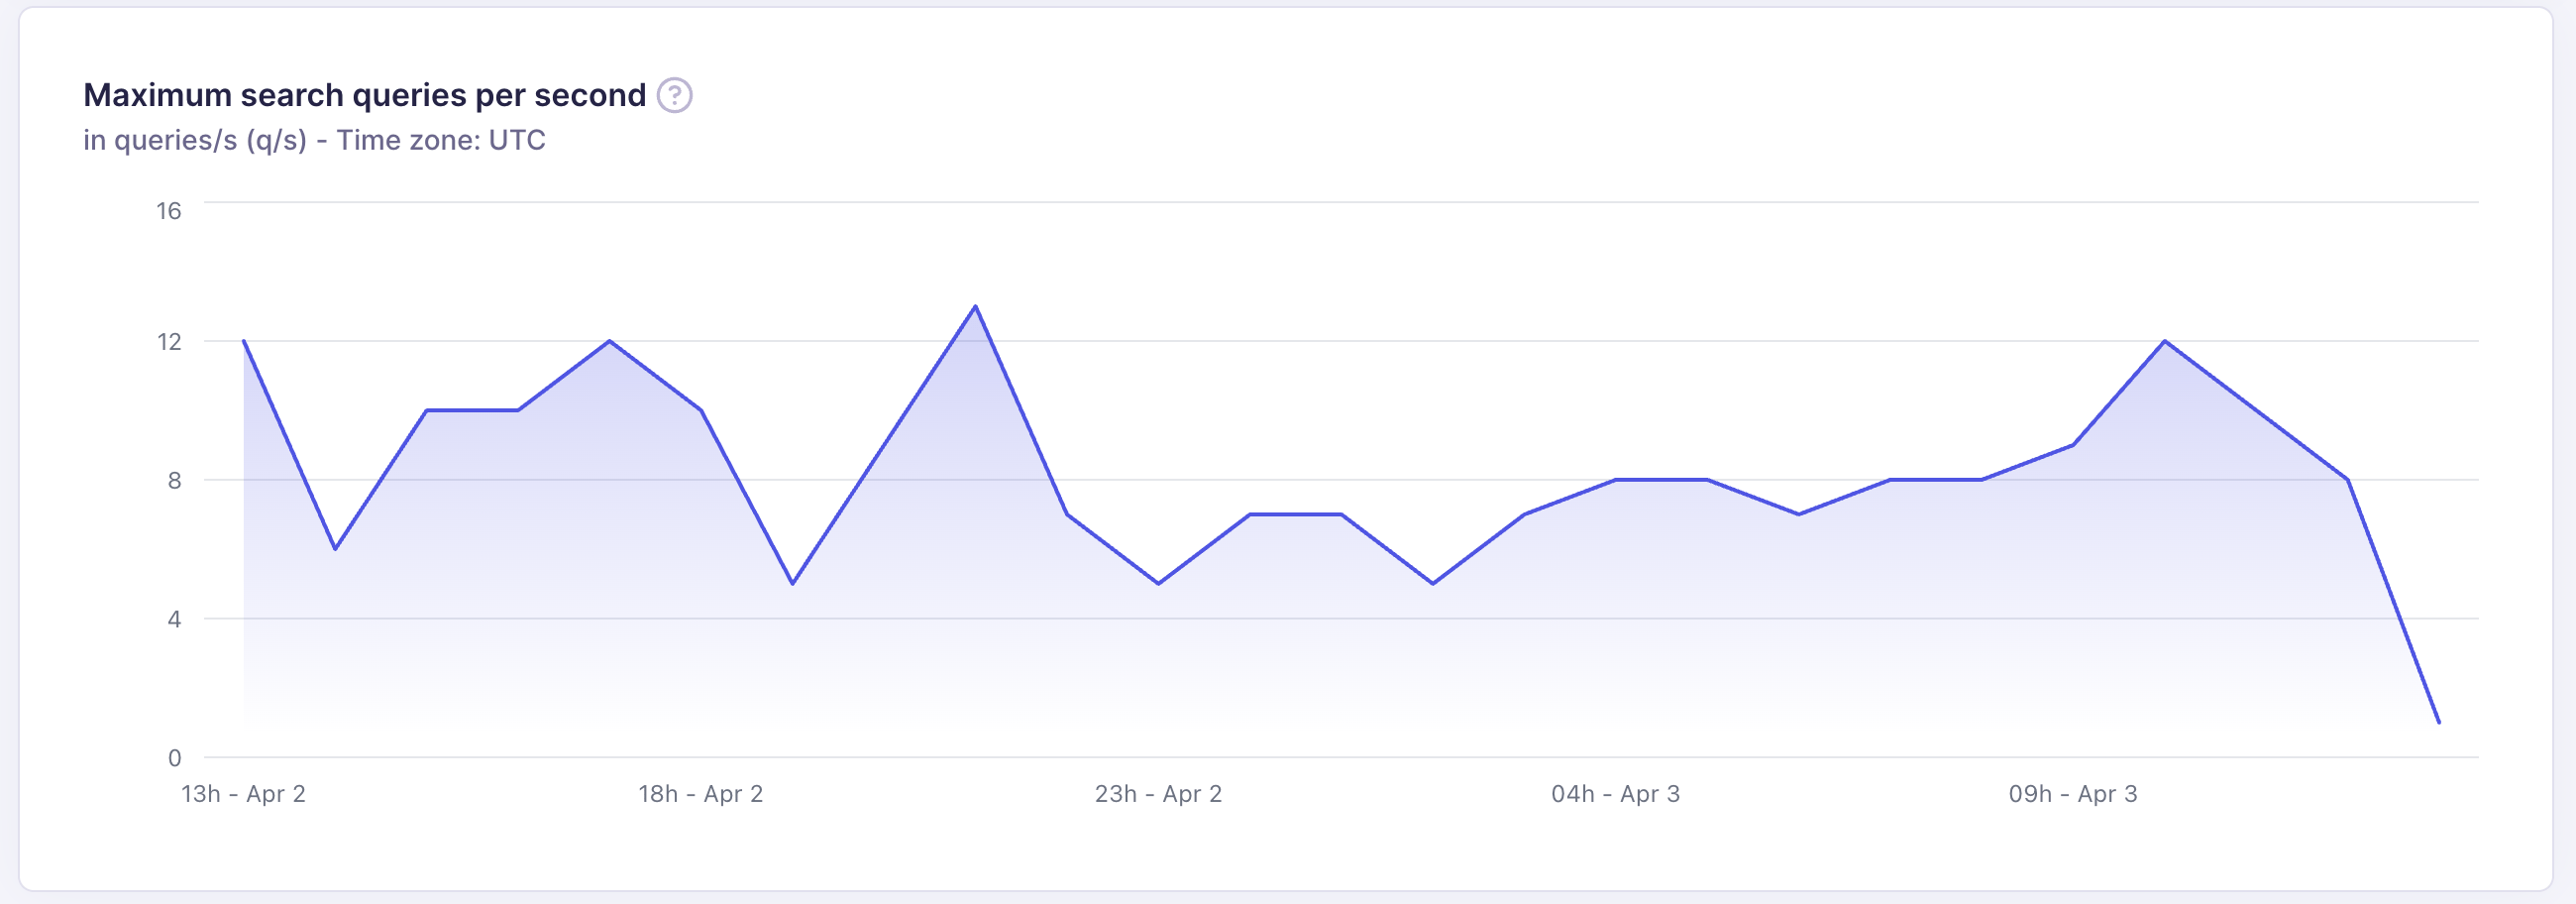
- Understand peak traffic patterns across the day or week
- Verify that your resource tier handles your traffic without latency degradation
- Detect unexpected traffic drops that may indicate application errors
Performance trace
Performance trace gives you a per-step breakdown of how time was spent during a search request. Use it to understand exactly where latency comes from, especially when your p99 is high but the cause is not obvious from aggregate metrics. To enable it, open the Search preview tab for your project and toggle Performance trace in the top-right of the results panel.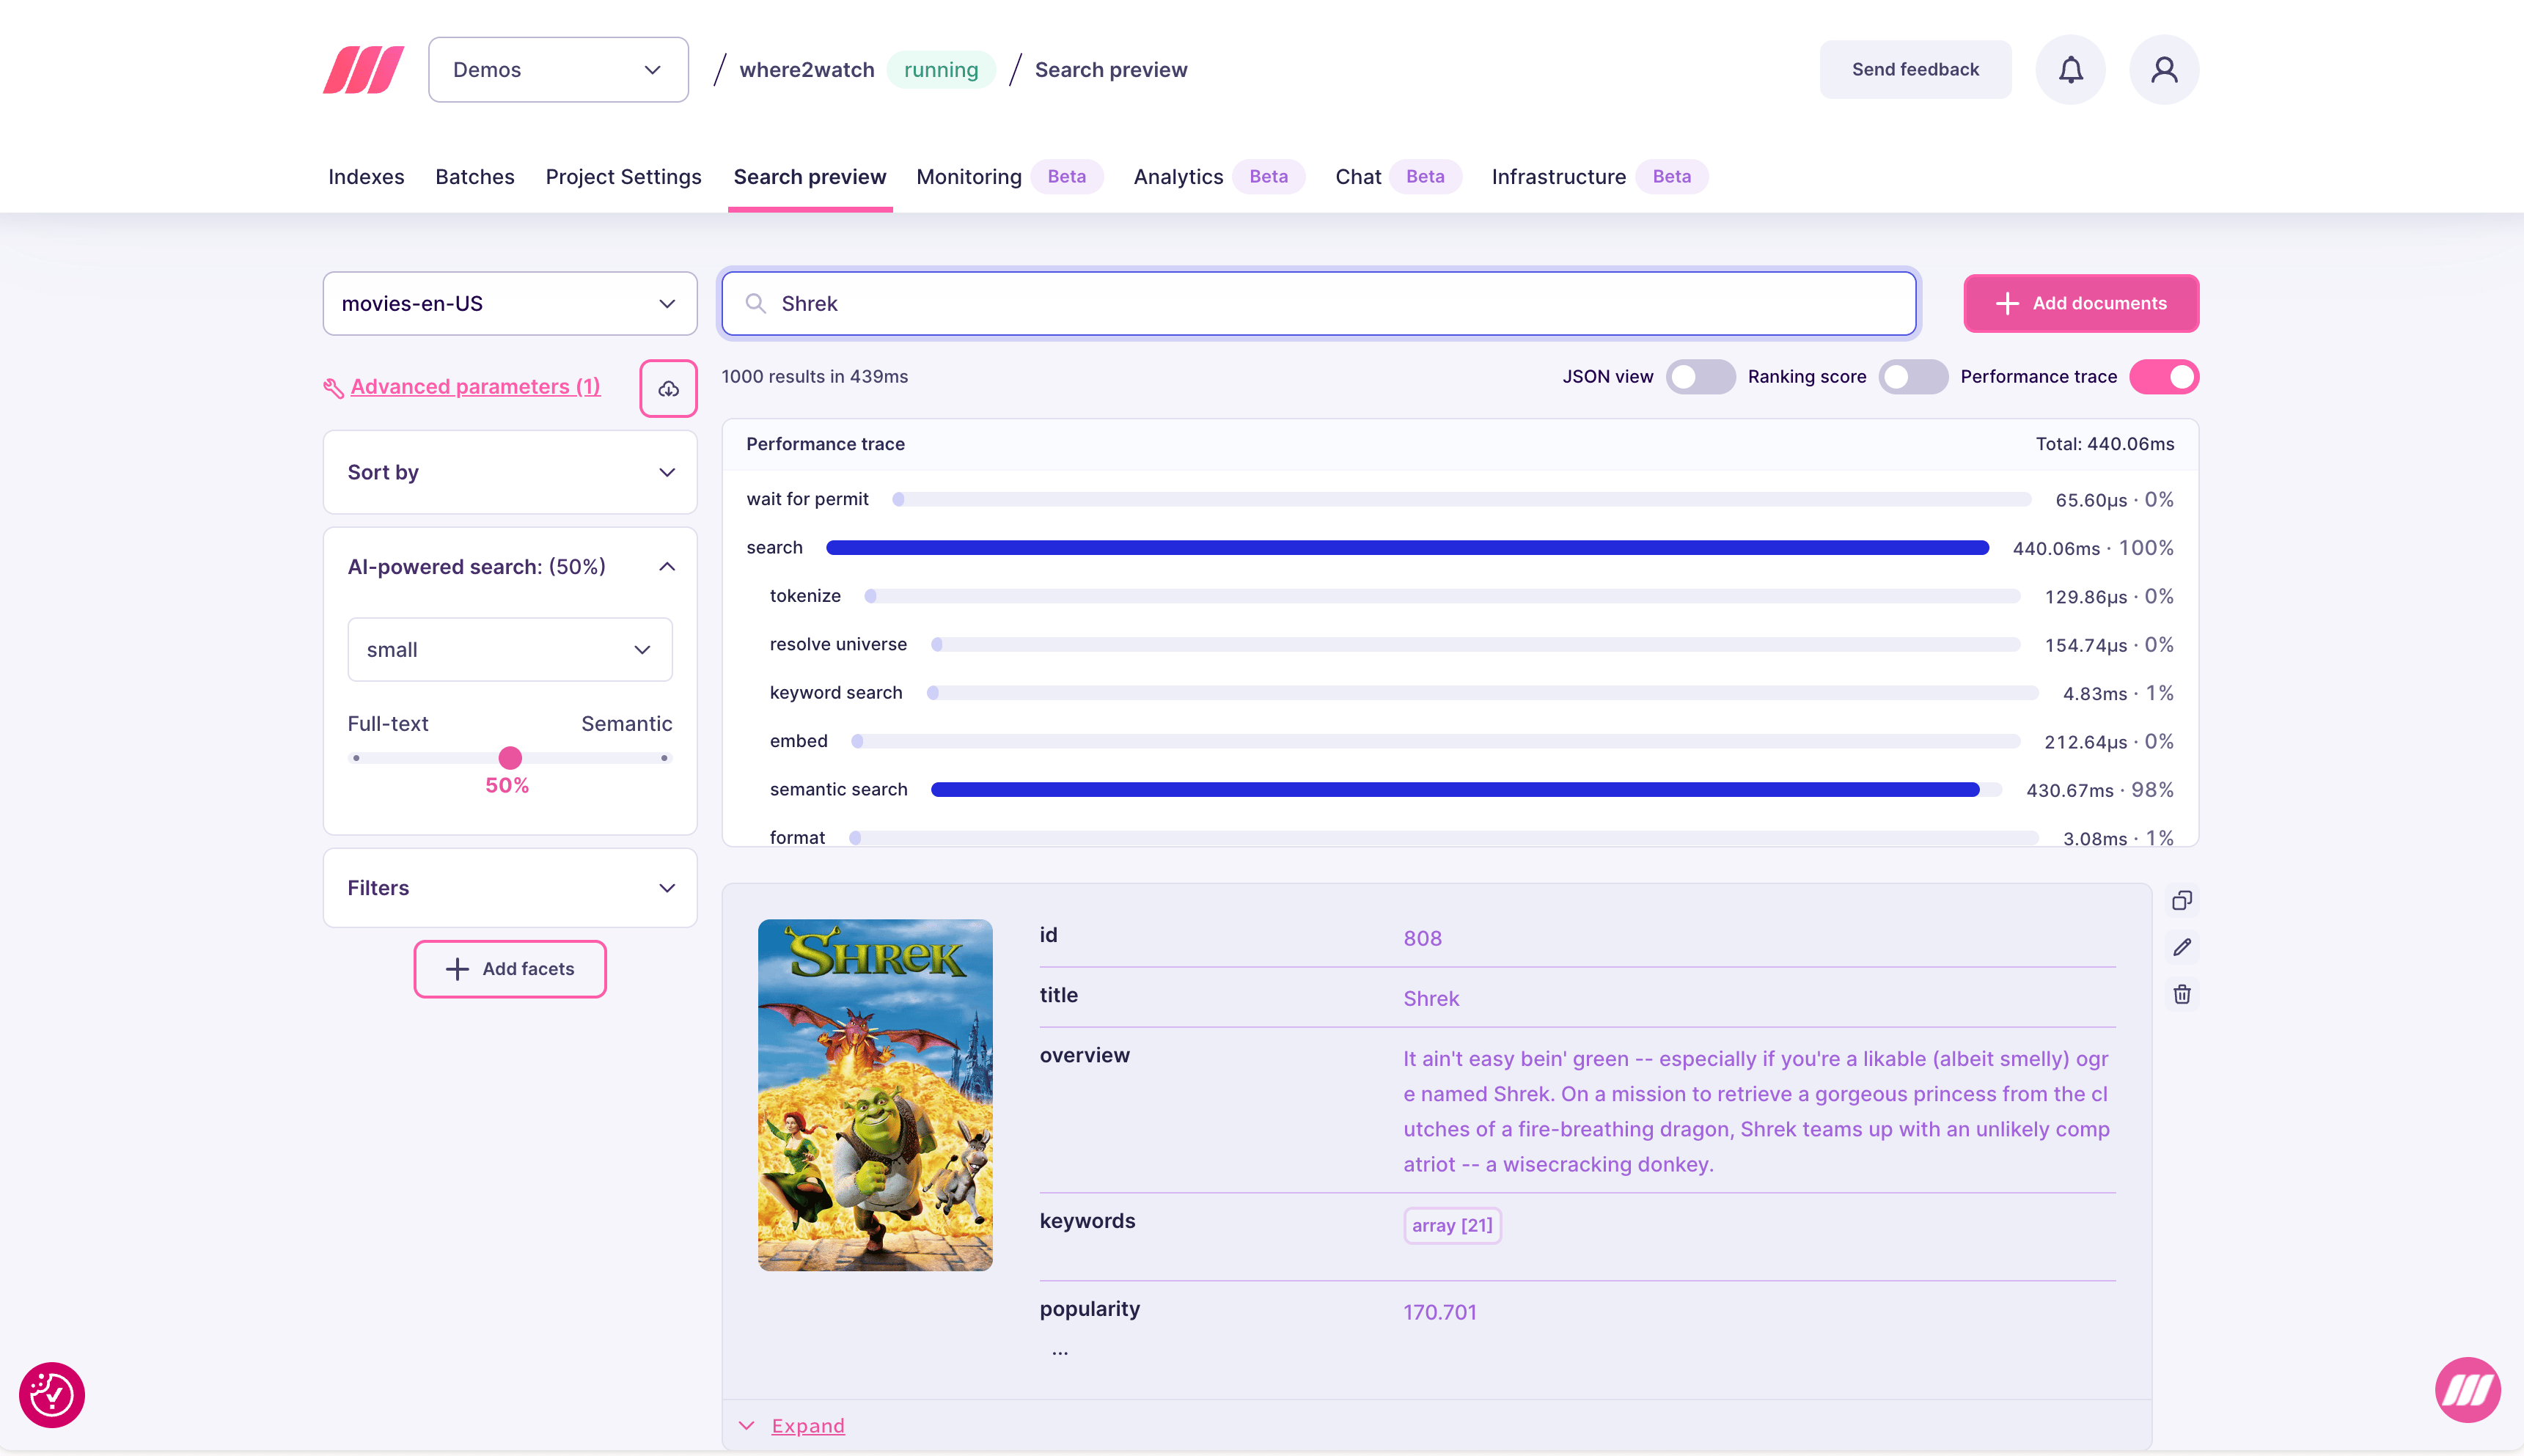
In the example above, semantic search accounts for 98% of total time (430 ms out of 440 ms). This is expected for hybrid search with a small model, and indicates the bottleneck is the vector search step rather than filtering or ranking.